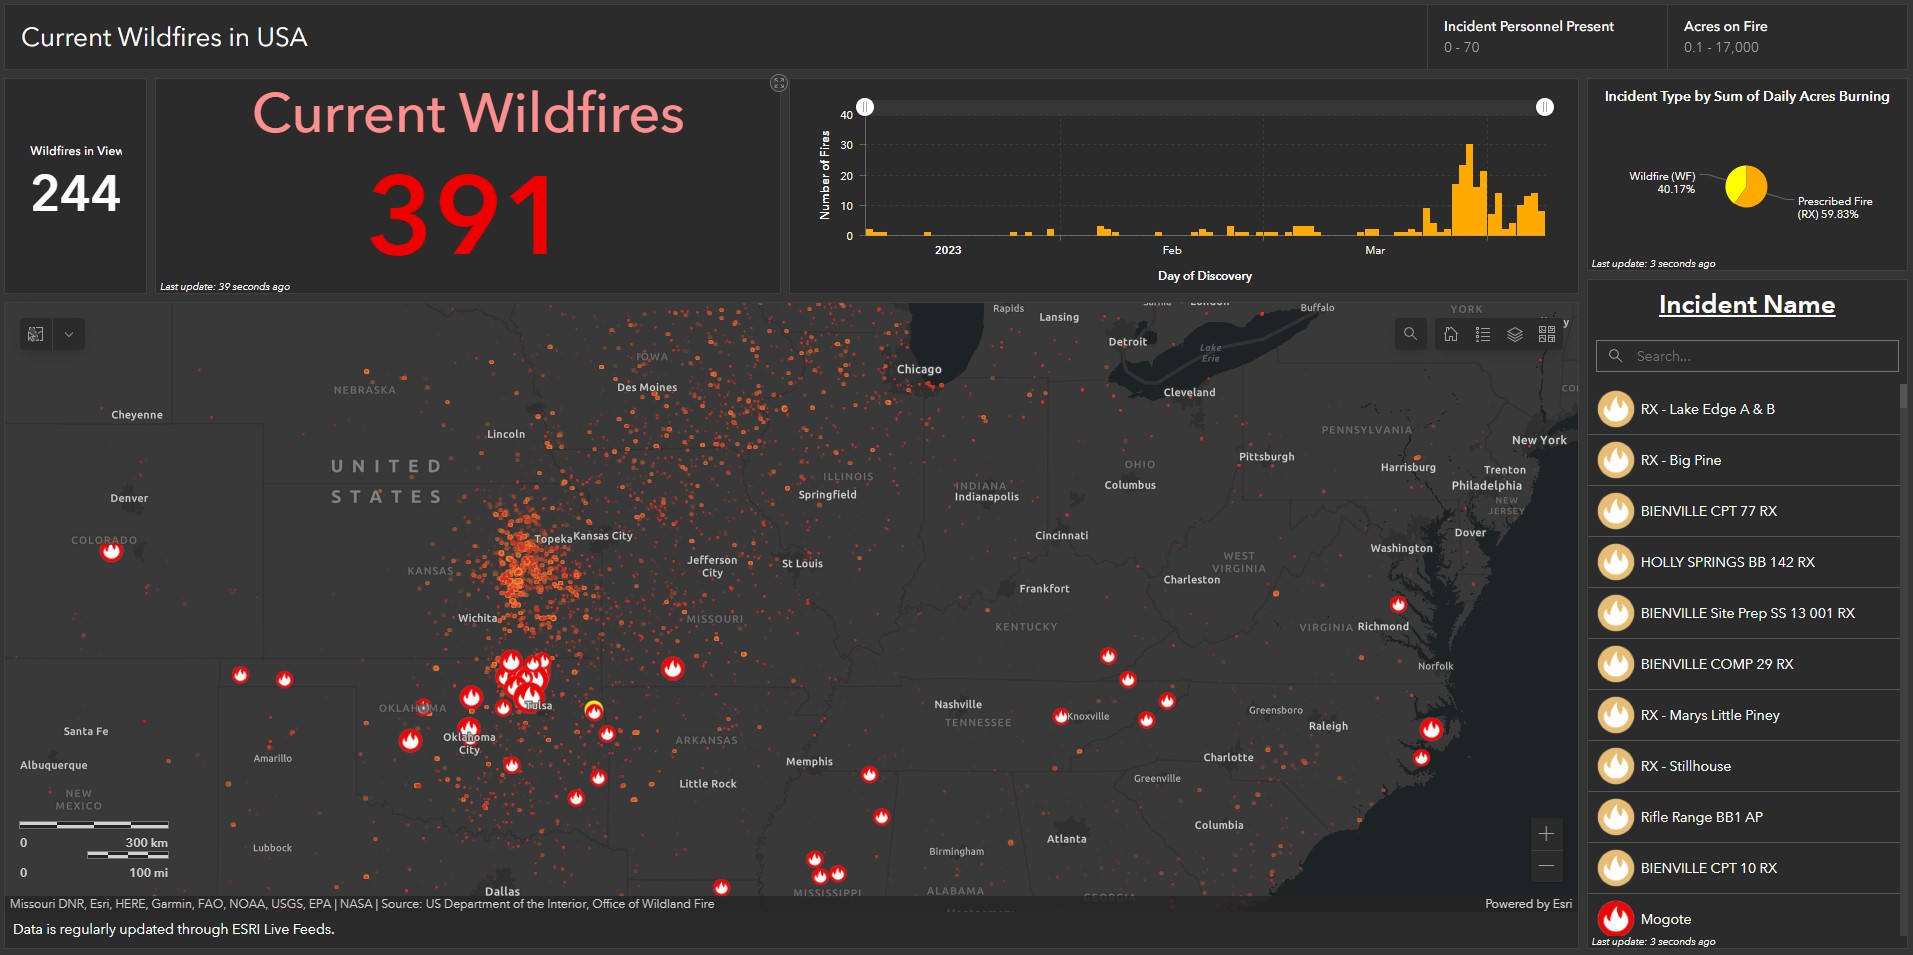
I designed this ArcGIS Online Dashboard to focus on current wildfires in the USA, when/where they are reported, type/size of active fire, and what the incident name is. The datasets used in this dashboard are updated every 15 minutes using ESRI's Aggregated Live Feed Methodology (click on this link for more on ESRI Live Feeds). Wildfire points are sourced from Integrated Reporting of Wildland-Fire Information (IRWIN) and perimeters from National Interagency Fire Center (NIFC). The Satellite (VIIRS) Thermal Hotspots and Fire Activity layer represents thermal activity detected by the VIIRS sensors on the NOAA/NASA Suomi NPP and NOAA-20 satellites during the last 7 days. For an overview of the data you see in this map, visit the USA Current Wildfires feature layer and the Satellite Thermal Hotspots and Fire Activity feature layer. Snapshot of dashboard above was taken 04/08/2023.
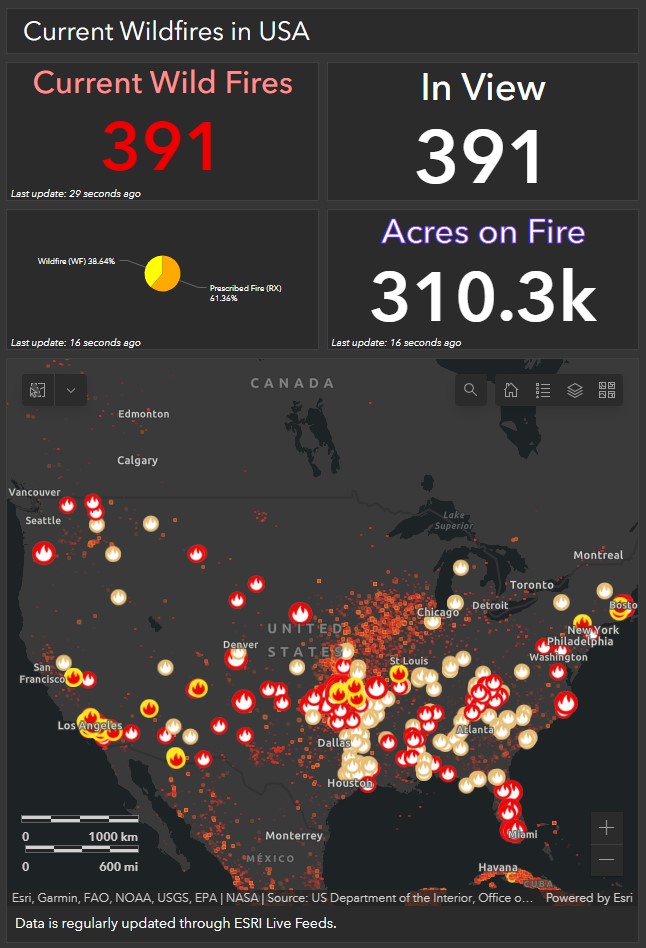
For mobile users, this dashboard has been reconfigured to provide as much information to the user while not cluttering the smaller screen. Snapshot of dashboard above was taken 04/08/2023.
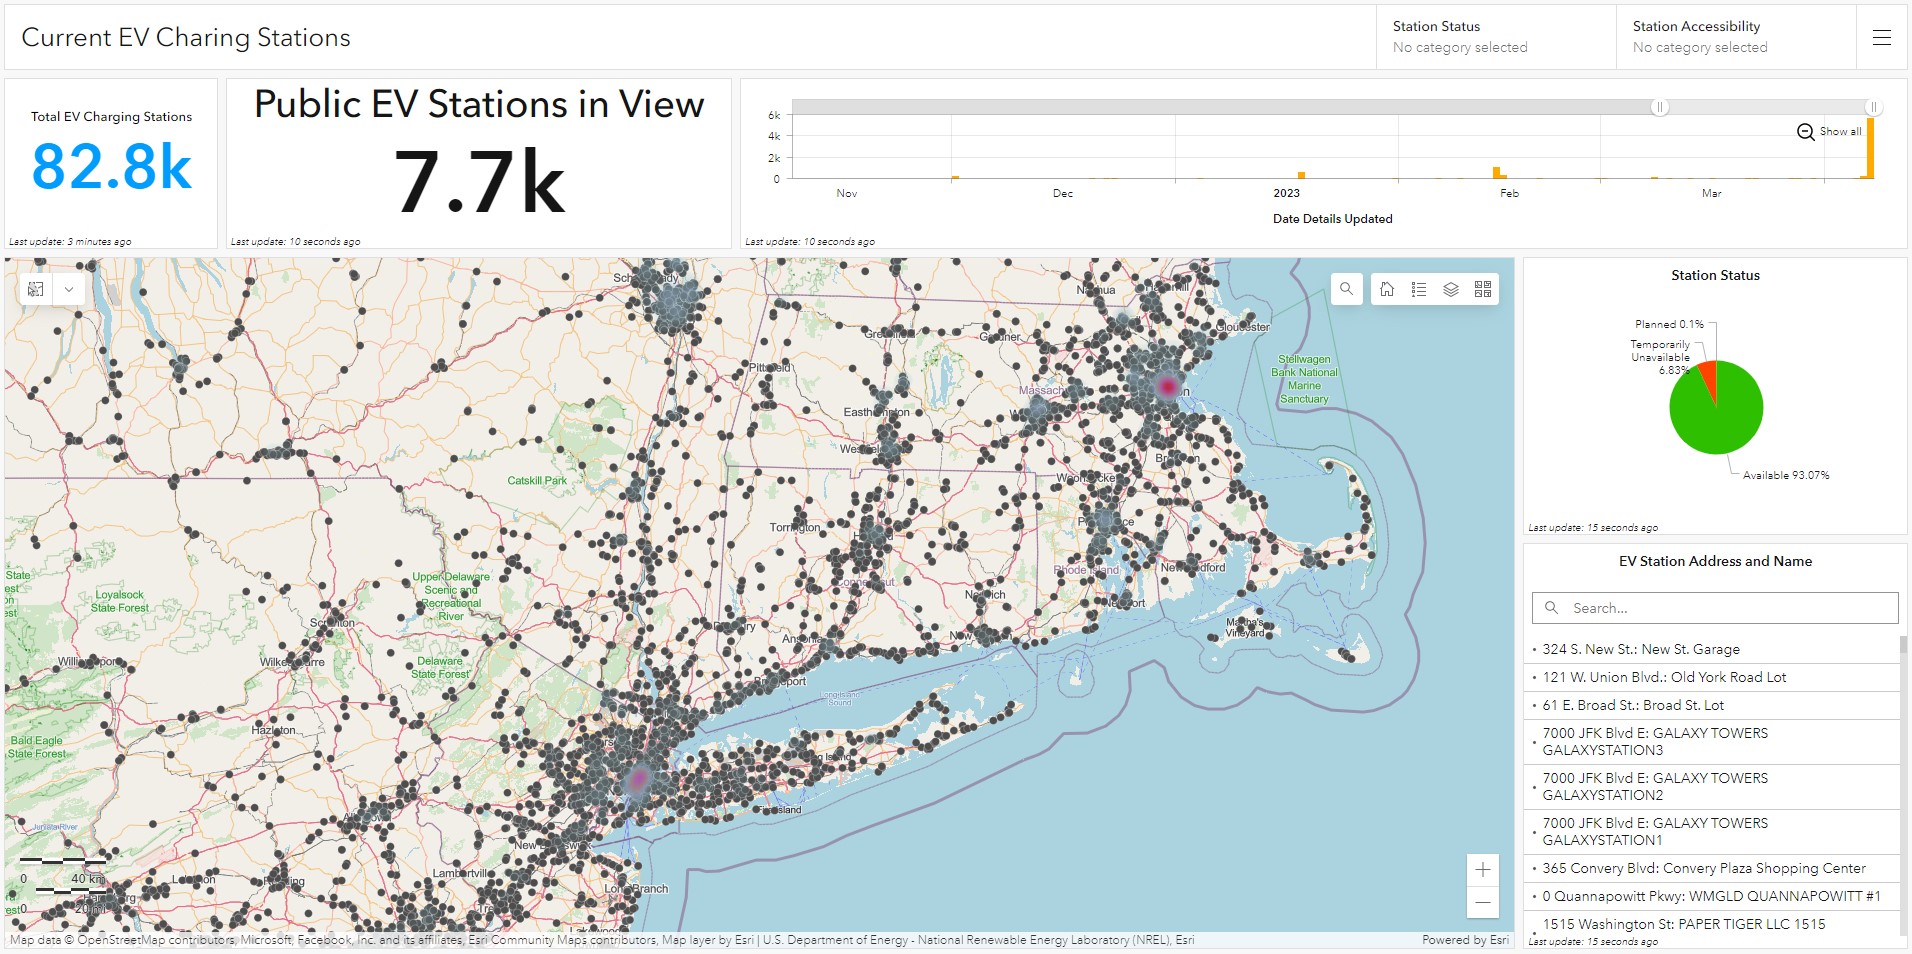
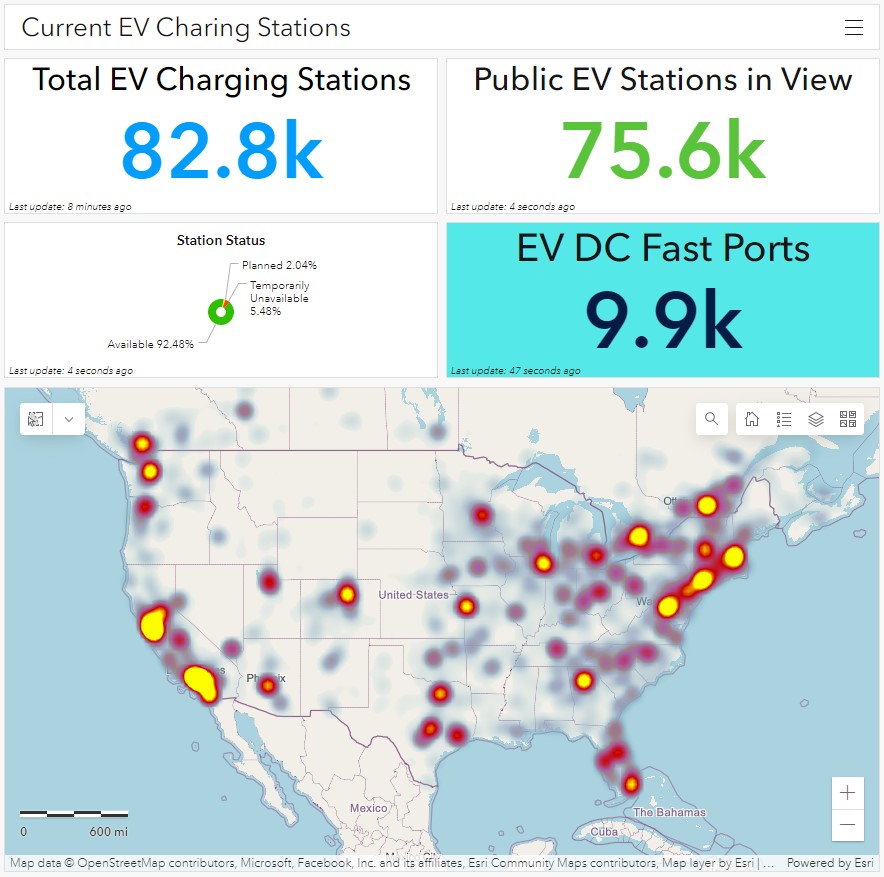
I designed this ArcGIS Online Dashboard to focus on current Electric Vehicle Charging Stations in the USA and Canada. This data is maintained by an Aggregated Live Feed routine that accesses the US Department of Energy's National Renewable Energy Laboratory (NREL) API website on a daily basis. For an overview of the data you see in this map, visit the Alternative Fuel Station feature layer. Snapshot of dashboard above was taken 04/08/2023.
For mobile users, this dashboard has been reconfigured to provide as much information to the user while not cluttering the smaller screen. Snapshot of dashboard above was taken 04/08/2023.